Table of Contents
JEE Main Marks vs Percentile 2025: A Complete Analysis
Pratham Jiwnani
4/29/2025
JEE Main Marks vs Percentile 2025: A Complete Analysis
Are you preparing for the JEE Main 2025 exam and feeling confused about how your marks translate into percentiles and ranks?
You're not alone! Understanding the relationship between marks and percentiles is key to planning your preparation, predicting your rank, and mapping your admission chances into prestigious engineering colleges like NITS, IIITS, and GFTIS.
This blog will briefly summarise the marks-to-percentile concept, explore how normalisation works, and provide a handy table to estimate your performance.
Let's demystify JEE Main Marks vs Percentile to help you stay ahead.
The Role of Percentile in JEE Admissions
The percentile system used in JEE Main is designed to compare students across multiple exam sessions. Since the exam is conducted in several shifts, the difficulty level may vary slightly between sessions. To ensure fairness, percentiles are calculated based on your performance relative to the candidates in your particular session, rather than your raw score.
But why does this matter? Put:
- Percentile scores determine your rank, the basis for admission to top engineering colleges.
- Cutoffs are based on percentiles, not raw marks, which helps normalise the score differences across sessions.
Now that we understand why percentiles matter, let's look at key terms you need to know.
Key Terms Explained
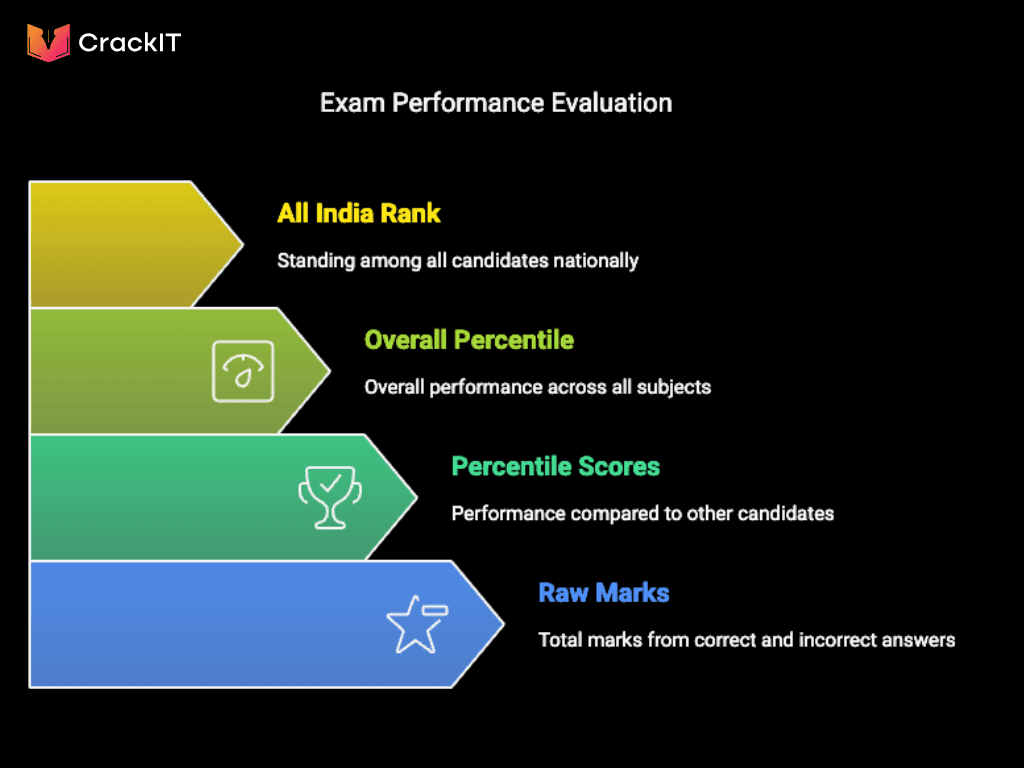
Marks
Marks refer to your raw score obtained directly by answering questions under JEE Main's marking scheme. Each question carries 4 marks, and incorrect answers result in a deduction of 1 mark.
Percentile
Your JEE percentile is a calculated value that shows the percentage of candidates who scored below you in your specific session. Percentiles ensure fairness by normalising marks across different slots.
Rank
Your All India Rank (AIR) is determined based on your percentile score. The higher your percentile, the better your rank.
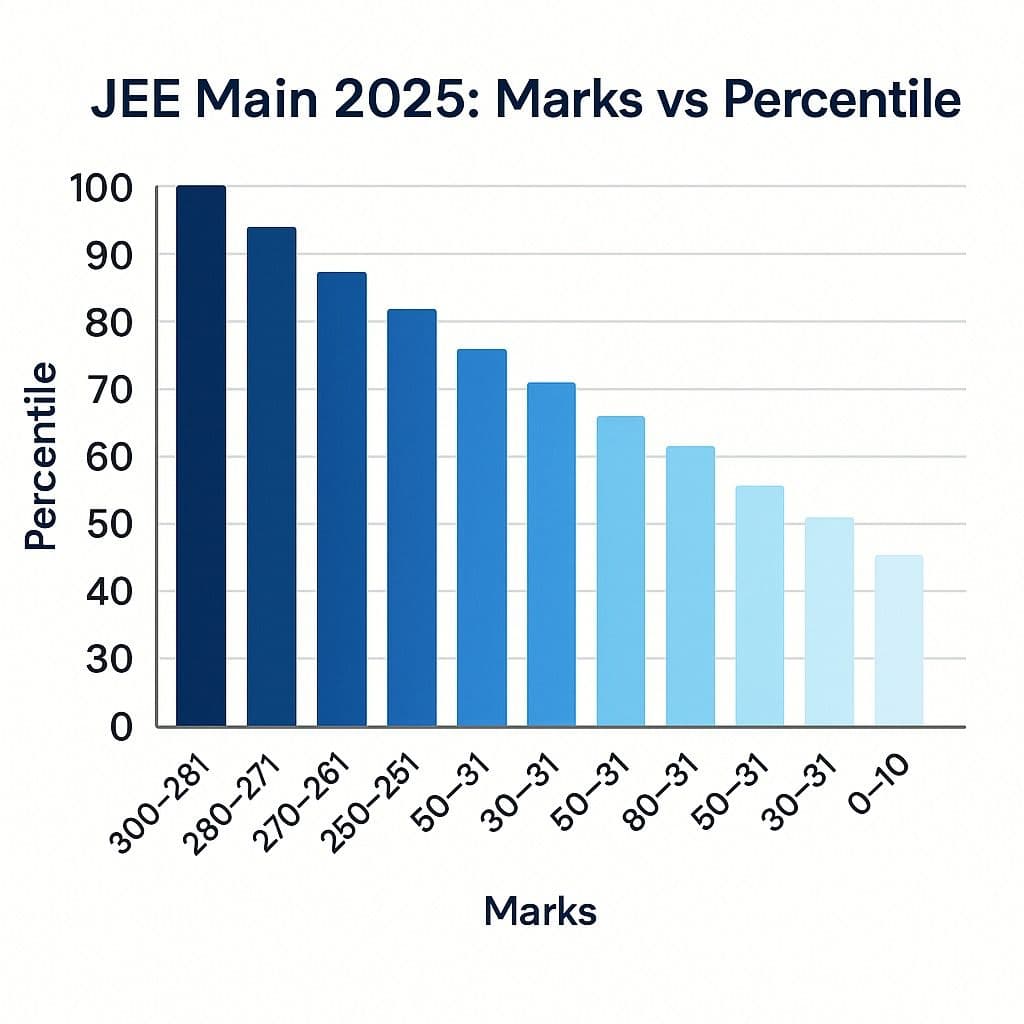
JEE Main Marks vs Percentile 2025 (Expected)
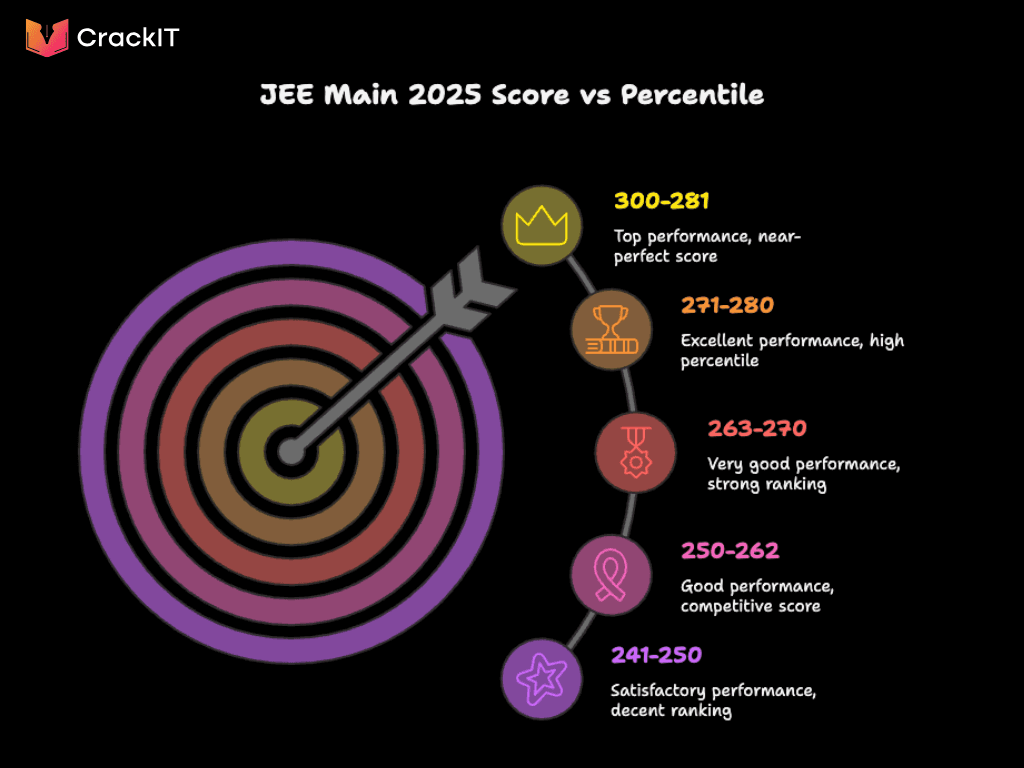
Below is an early estimate of how marks may correspond to percentile scores for JEE Main 2025.
Note that these figures are based on trends from previous years, and actual percentiles may vary depending on the exam's difficulty level.
| JEE Main 2025 Marks | JEE Main 2025 Percentile |
|---|---|
| 175 | 99 |
| 163 | 98.5 |
| 153 | 98 |
| 146 | 97.5 |
| 140 | 97 |
| 134 | 96.5 |
| 129 | 96 |
| 126 | 95.5 |
| 120 | 95 |
| 113 | 94 |
| 107 | 93 |
| 101 | 92 |
| 91 | 96.3 |
| 90 | 91.6 |
This table only serves as a guideline. Percentiles can fluctuate based on the number of test-takers and overall exam difficulty.
Factors Affecting JEE Main Percentiles
What influences your final percentile? Here's a list of factors that could impact how your raw marks are translated into percentiles:
- Session Difficulty: Your performance is relative to other students in the same session.
- Number of Candidates: Larger sessions may result in minor percentile differences between marks.
- Normalisation Here, the National Testing Agency (NTA) calculates percentiles to balance score discrepancies caused by session variations.
What is the JEE Main 2025 Percentile Score?
JEE Main 2025 percentile score evaluates a student's performance in the Joint Entrance Examination (JEE) Main. It is calculated based on the student's relative performance compared to other candidates appearing for the same session.
The percentile score represents the percentage of students who have scored equal to or below your score. For example, if you have obtained a percentile score of 95, you have performed better than 95% of the candidates who appeared for the exam in your session. Don't miss out on reading. Can I crack BITSAT if I failed in JEE Mains?
| JEE Main 2025 Percentile | JEE Main 2025 Rank |
|---|---|
| 100 - 99.9992043 | 1 - 30 |
| 99.9937403 - 99.997394 | 145 - 233 |
| 99.9004 - 99.8982 | 1641 - 1677 |
| 99.977205 - 99.988819 | 210 - 85 |
| 99.960163 - 99.975034 | 367 - 215 |
| 99.8016695 - 99.7938333 | 3186 - 3290 |
| 99.901113 - 99.928901 | 911 - 610 |
| 99.7018301 - 99.6987428 | 4699 - 4731 |
| 99.6007682 - 99.5966798 | 6291 - 6328 |
| 99.5010703 - 99.49677 | 7753 - 7824 |
| 99.4004213 - 99.3999618 | 9345 - 9358 |
| 99.3031387 - 99.2944396 | 10816 - 10903 |
| 99.203587 - 99.1994097 | 12397 - 12536 |
| 99.028614 - 99.239737 | 8949 - 6800 |
| 99.1043692 - 99.0928856 | 13985 - 14037 |
| 99.0052802 - 98.9999641 | 15475 - 15509 |
| 97.811260 - 98.254132 | 20164 - 15700 |
| 98.5003488 - 98.499 | 23079 - 23143 |
| 98.000774 - 97.9999601 | 30646 - 30738 |
| 94.998594 - 96.064850 | 46076 - 35000 |
| 97.5087622 - 97.4946488 | 38180 - 38275 |
| 97.0042358 - 96.9987574 | 45729 - 45808 |
| 96.55 - 96.4896688 | 152689 - 53132 |
| 95.5040366 - 95.491651 | 68086 - 68304 |
| 94.008 - 93.9884614 | 89947 - 90372 |
| 93.1023262 - 93.0950208 | 102450 - 103113 |
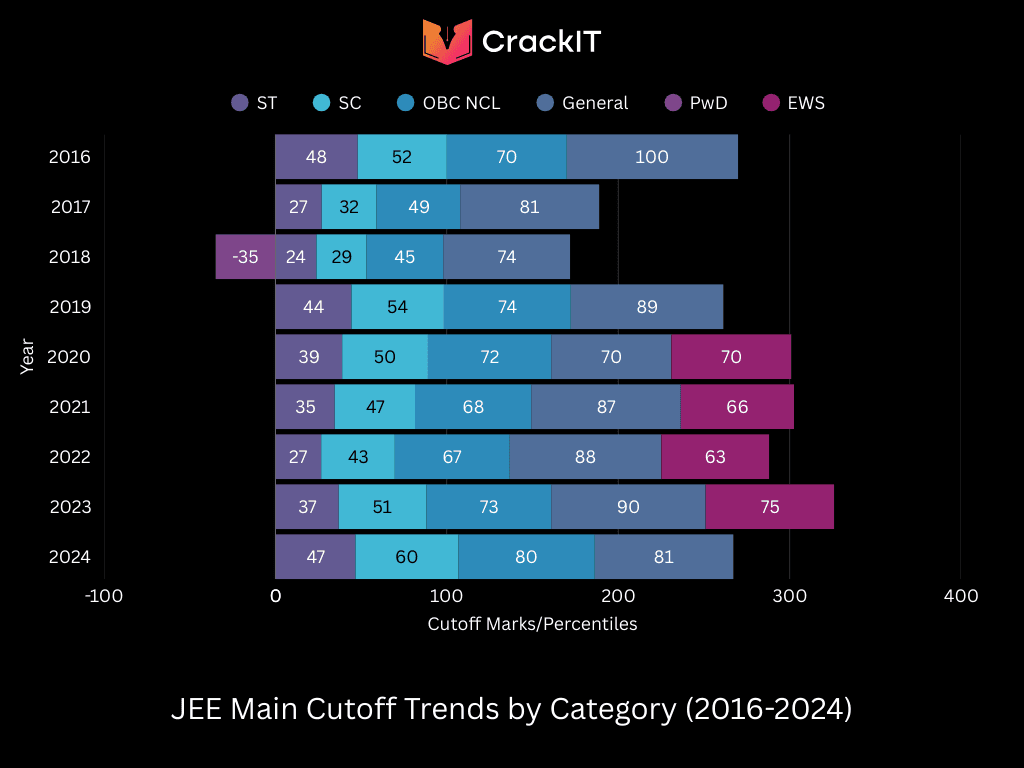
JEE Main Cutoff Trends - 2016-2024 Years Cut Off Category Wise
How is JEE Main 2025 Percentile Score Calculated?
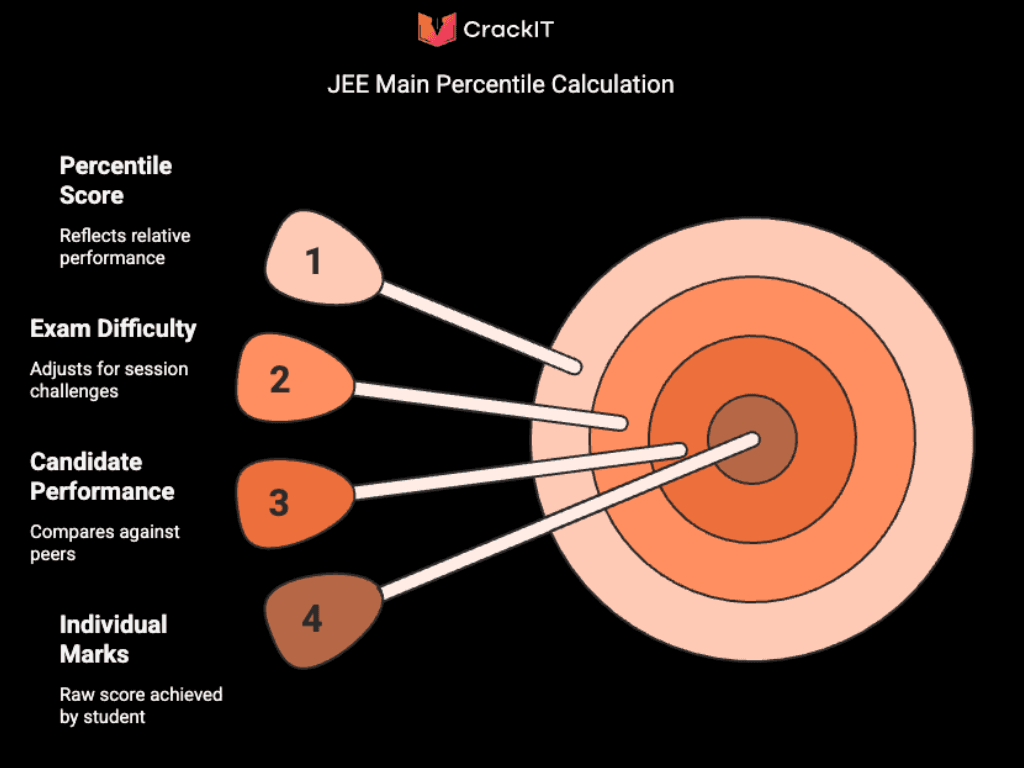
The JEE Main 2025 percentile score is calculated using a normalisation process that accounts for exam difficulty, average performance of candidates, and individual scores.
For example, two students scoring the same marks in different sessions may have different percentiles due to session difficulty or overall candidate performance.
Percentile scores provide a fair comparison by considering external factors, rather than just marks. They reflect an individual's performance relative to others and help identify areas for improvement. Students should view percentiles as a tool for setting realistic goals, not as a measure of intelligence or capability.
Percentiles can vary between exams or sections, making them crucial for understanding one's standing and academic progress. They are also valuable for university admissions or job applications, indicating academic potential in competitive environments.
JEE Mains 2025 Expected Cutoff
Here's the expected JEE Main 2025 cutoff based on category. This provides valuable insight to help you gauge the scores required for qualification.
| Category | Expected JEE Main 2025 Cutoff (%) |
|---|---|
| CRL | 100.0000000 to 92.3362181 |
| OBC-All | 92.2312696 to 79.6457881 |
| SC-All | 92.2312696 to 62.0923182 |
| ST-All | 92.2312696 to 47.6975840 |
| UR-PwD | 92.2041331 to 0.0015700 |
Remember that these cutoffs are projections and could vary depending on factors such as the total number of candidates, difficulty level of the exam, and normalisation processes. Stay focused and aim to secure your desired percentile and category rank!
How is the Percentile Calculated?
NTA employs a normalisation process to ensure fairness across multiple shifts with varying difficulty levels. Here's how it works in simple terms: Normalisation
Raw Marks: Your raw marks are the total of correct and incorrect answers. You gain marks for correct responses, which are deducted for incorrect ones (if there's negative marking in the exam).
Percentile Scores: After calculating your raw marks, the exam uses percentiles to compare your performance with others. Percentiles are calculated separately for each subject (Mathematics, Physics, Chemistry) and your overall score.
| TOTAL UNIQUE CANDIDATES | APRIL ATTEMPT 2025 |
|---|---|
| TOTAL REGISTERED | 10,61,840 |
| TOTAL APPEARED | 9,92,350 |
| TOTAL UNIQUE CANDIDATES | JAN ATTEMPT 2025 |
| TOTAL REGISTERED | 13,11,544 |
| TOTAL APPEARED | 12,58,136 |
What's a percentile?
A percentile shows where you stand compared to other candidates.
The formula is:
Percentile Formula
To calculate the percentile rank of a score, use the following formula:
Percentile =(Number of candidates who scored less than your score/Total number of candidates) × 100
This formula determines the percentage of candidates who scored less than a particular score.
Example
Suppose you took an exam along with 200 candidates, and 190 of them scored less than you. Applying the formula:
Percentile = (190/200)×100=95 {Percentile}
This means you're at the 95th percentile, outperforming 95% of the candidates.
Overall Percentile and All India Rank (AIR): Once your percentiles for individual subjects and overall performance are calculated, your overall percentile determines your All India Rank (AIR). Your AIR shows your standing among all candidates across the country.
This system ensures that your rank reflects your raw marks and performance relative to others in the same session.
Impact of normalisation on Final Percentile
The normalisation process ensures equity by aligning scores across sessions. However, slight variations in difficulty can lead to unexpected percentiles, which makes it crucial to aim for consistently high marks.
Predicting College Admission Chances
With your percentile in hand, you can predict your chances of admission to NITs, IIITs, and GFTIs using tools like Crackit's JEE College Predictor. Based on your percentile:
- 95+ Percentile could open doors to top-tier NITs in popular branches like CSE and ECE.
- 90–95 Percentile increases eligibility for IIITs and mid-tier NITs.
- Percentiles below 90 may still secure branches in GFTIs, depending on the category and preference.
JEE Main 2025 Cutoff
The cutoff percentile marks are critical for determining your eligibility for JEE Advanced and admission to NITS and IIITS. Based on past patterns, here's an of cutoff percentiles for JEE Main 2025:
| Category | Cutoff Percentile |
|---|---|
| General (UR) | 93.1023262 |
| Economically Weaker Section (EWS) | 80.3830119 |
| Other Backward Classes (OBC-NCL) | 79.4313582 |
| Scheduled Caste (SC) | 61.1526933 |
| Scheduled Tribe (ST) | 47.9026465 |
| Persons with Disabilities (PwD) | 0.0079349 |
Resources and Tools for JEE Preparation
Preparing for JEE Main can be overwhelming. Here are expert-recommended tools to help boost your preparation:
- Online Mock Tests: Regular practice tests can improve speed and accuracy.
- Formula Sheets: Revise key formulas and concepts for quick recall.
- College Predictor Tools: Platforms like Crackit help you visualise college options based on your percentile.
Crackit College Predictor Tool
The Crackit College Predictor Tool is a valuable resource for students preparing for JEE Main. It uses your percentile score to predict potential colleges and branches you may qualify for based on previous trends and cut-offs.
This tool provides detailed insights into various colleges, helping you make informed decisions about your future. By entering your category, percentile, and other details, you can explore tailored options that align with your performance. It's an essential companion for JEE aspirants aiming to strategise their applications more effectively.
Using College Predictor for JEE Main
In addition to its powerful features of predicting colleges and branches, the College Predictor tool can also provide valuable information and guidance for JEE Main aspirants. Here are some ways you can use this tool to benefit your preparation process:
- Explore your options: Access a wide range of colleges and branches to find the best fit for your aspirations.
- Understand trends: Analyse past data on cut-offs, seats, and categories to make accurate predictions.
- Get personalised recommendations: Tailored suggestions based on your academic profile and scores.
- Plan: Strategise your applications with predicted cut-offs and seat availability.
- Save time: Skip manual research with a comprehensive list of options.
- Identify backups: Have choices ready if your top picks aren't available.
- Stay updated: Get the latest cut-offs and admission trends for informed decisions.
The College Predictor simplifies the admission process, saving time and offering data-driven guidance to help you secure the best possible college for your goals.
Tips for Improving Your JEE Performance
- Focus on Weak Areas: Identify chapters where you lose marks and solve more problems in that domain.
- Practice Time Management: During mock tests, distribute time wisely across sections.
- Regular Revision: Allocate time to revisit important topics weekly.
- Seek Guidance: Join online forums or seek mentorship from JEE experts for test-taking strategies.
Unlock Your Potential
Understanding marks versus percentiles in JEE Main 2025 is crucial for streamlining your preparation and setting realistic goals. Remember, success in JEE is not just about marks but the efficient use of resources and strategies.
Get an edge in your preparation with Crackit's free tools and resources, including the JEE Main College Predictor. Start planning your future today!
Categories
Join the Discussion
0 comments